About
 I am a data scientist and visualisation expert, former assistant Professor at the Computer Science Department at the University of Tübingen, Germany. My lab used to conduct research in the development, application, and evaluation of visual-analytics tools and visualization techniques, with a focus on bioinformatics and high-dimensional data.
I am also the co-founder and a general chair of the IEEE International Symposium on Big Data Visual Analytics (BDVA) as well as a member of the organising committee of the Symposium on Biological Data Visualization (BioVis) and the Conference on Visualizing Biological Data (VIZBI).
I am a data scientist and visualisation expert, former assistant Professor at the Computer Science Department at the University of Tübingen, Germany. My lab used to conduct research in the development, application, and evaluation of visual-analytics tools and visualization techniques, with a focus on bioinformatics and high-dimensional data.
I am also the co-founder and a general chair of the IEEE International Symposium on Big Data Visual Analytics (BDVA) as well as a member of the organising committee of the Symposium on Biological Data Visualization (BioVis) and the Conference on Visualizing Biological Data (VIZBI).
Have a look at my CV for more information on my background and experience, or checkout my list of publications or Google Scholar Profile
Projects
Personalised Oncology via Semantic Integration of Data
![]() The central goal of this project is to develop a software system for providing homogeneous and intuitive access to all data relevant to therapeutic decisions. The project will enable clinicians to (a) select stratified patient cohorts based on a full semantic integration of clinical and high-throughput (HT) data and (b) to bring personalised tumor therapy to a new level through a touch-based visual analytics tool allowing intuitive access to all data – literally ‘information at your fingertips’.
The central goal of this project is to develop a software system for providing homogeneous and intuitive access to all data relevant to therapeutic decisions. The project will enable clinicians to (a) select stratified patient cohorts based on a full semantic integration of clinical and high-throughput (HT) data and (b) to bring personalised tumor therapy to a new level through a touch-based visual analytics tool allowing intuitive access to all data – literally ‘information at your fingertips’.
Viewpoint Selection for Molecular Structures
 Selecting a viewpoint for molecular structures is a common task in science and outreach, for example to create figures for publications. This project aims at automating the process of finding “good” viewpoints by understanding what constitutes a good viewpoint for different user groups and developing algorithms to find the best viewpoints for a given task.
Sign up if you are a structural biologist or work in a related field and have experience with visualizations of molecular structures. I will then contact you to ask for your help in judging viewpoints for various tasks in structural biology.
The Dark Proteome
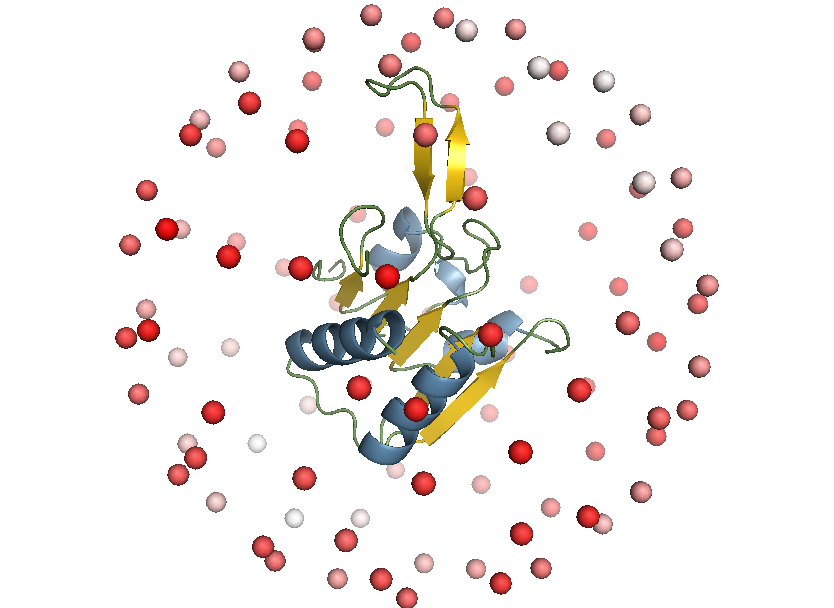
 In this project, we surveyed the “dark” proteome–that is, regions of proteins never observed by experimental structure determination and inaccessible to homology modeling. For 546,000 Swiss-Prot proteins, we found that 44–54% of the proteome in eukaryotes and viruses was dark, compared with only ∼14% in archaea and bacteria. Surprisingly, most of the dark proteome could not be accounted for by conventional explanations, such as intrinsic disorder or transmembrane regions. Have a look at our PNAS paper to learn more about the dark proteome.
Aquaria
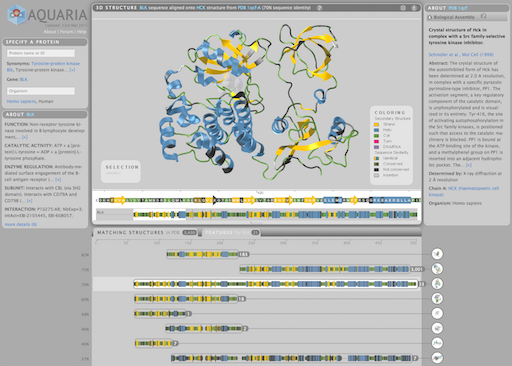 Aquaria is an award-winning, web-based resource to facilitate insight from protein structures. Given a protein name or Uniprot identifier, Aquaria shows all related structures in a concise overview. The Aquaria database contains millions of protein sequence-to-structure alignments which
can be explored interactively from the website.
Aquaria is an award-winning, web-based resource to facilitate insight from protein structures. Given a protein name or Uniprot identifier, Aquaria shows all related structures in a concise overview. The Aquaria database contains millions of protein sequence-to-structure alignments which
can be explored interactively from the website.
Parallel Coordinates
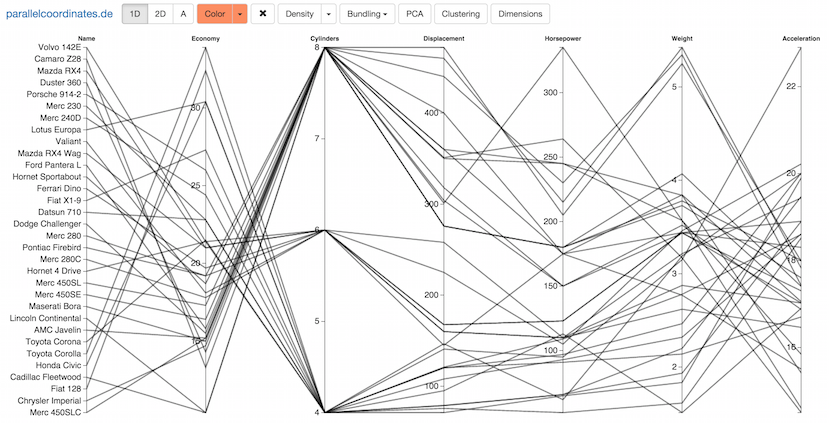 Parallel coordinates is a visualization technique for multidimensional geometry invented by Alfred Inselberg. By placing axes in parallel, multidimensional points are mapped to lines, creating patterns that hint at linear and non-linear relationships between the variables. Learn more about parallel coordinates at my blog, and play with an interactive version here.
BDVA
![]() The first IEEE International Symposium on Big Data Visual Analytics (BDVA) was held from September 22-25 in Hobart, Tasmania. The conference featured six internationally renowned keynote speakers, four complimentary workshops, a paper track, a poster session, a panel discussion about immersive analytics, and a spectacular social event at the Museum of Old and Modern Art (MONA).
The first IEEE International Symposium on Big Data Visual Analytics (BDVA) was held from September 22-25 in Hobart, Tasmania. The conference featured six internationally renowned keynote speakers, four complimentary workshops, a paper track, a poster session, a panel discussion about immersive analytics, and a spectacular social event at the Museum of Old and Modern Art (MONA).
Publications
Journals
- Heinrich, J., Vuong, J., Hammang, C. J., Wu, A., Rittenbruch, M., Hogan, J., … O’Donoghue, S. I. (2016). Evaluating Viewpoint Entropy for Ribbon Representation of Protein Structure. Computer Graphics Forum, 35(3). pdf
- Perdigão, N., Heinrich, J., Stolte, C., Sabir, K. S., Buckley, M. J., Tabor, B., … O’Donoghue, S. I. (2015). Unexpected features of the dark proteome. Proceedings of the National Academy of Sciences, 201508380. http://doi.org/10.1073/pnas.1508380112 online
- Heinrich, J., & Weiskopf, D. (2015). Parallel Coordinates for Multidimensional Data Visualization: Basic Concepts. Computing in Science Engineering, 17(3), 70–76. http://doi.org/10.1109/MCSE.2015.55 pdf
- O’Donoghue, S. I., Sabir, K. S., Kalemanov, M., Stolte, C., Wellmann, B., Ho, V., … Schafferhans, A. (2015). Aquaria: simplifying discovery and insight from protein structures. Nature Methods, 12(2), 98–99. http://doi.org/10.1038/nmeth.3258 online
- Stolte, C., Sabir, K. S., Heinrich, J., Hammang, C. J., Schafferhans, A., & O’Donoghue, S. I. (2015). Integrated visual analysis of protein structures, sequences, and feature data. BMC Bioinformatics, 16(Suppl 11), S7. http://doi.org/10.1186/1471-2105-16-S11-S7 pdf online
- Heinrich, J., Krone, M., O’Donoghue, S. I., & Weiskopf, D. (2014). Visualising intrinsic disorder and conformational variation in protein ensembles. Faraday Discussions, 169(1), 179–193. http://doi.org/10.1039/C3FD00138E pdf online
- Grottel, S., Heinrich, J., Weiskopf, D., & Gumhold, S. (2014). Visual Analysis of Trajectories in Multi-Dimensional State Spaces. Computer Graphics Forum, 33(6), 310–321. http://doi.org/10.1111/cgf.12352 pdf online
- Hasenauer, J., Heinrich, J., Doszczak, M., Scheurich, P., Weiskopf, D., & Allgöwer, F. (2012). A visual analytics approach for models of heterogeneous cell populations. EURASIP Journal on Bioinformatics and Systems Biology, 2012(1), 1–13. http://doi.org/10.1186/1687-4153-2012-4 online
- Bartlett, C. W., Yeon Cheong, S., Hou, L., Paquette, J., Yee Lum, P., Jäger, G., … Ray, W. C. (2012). An eQTL biological data visualization challenge and approaches from the visualization community. BMC Bioinformatics, 13(Suppl 8), S8. http://doi.org/10.1186/1471-2105-13-S8-S8 pdf online
- Heinrich, J., Vehlow, C., Battke, F., Jäger, G., Weiskopf, D., & Nieselt, K. (2012). iHAT: interactive Hierarchical Aggregation Table for Genetic Association Data. BMC Bioinformatics, 13(Suppl 8), S2. pdf
- Heinrich, J., Bachthaler, S., & Weiskopf, D. (2011). Progressive Splatting of Continuous Scatterplots and Parallel Coordinates. Computer Graphics Forum, 30(3), 653–662. pdf
- Burch, M., Konevtsova, N., Heinrich, J., Hoeferlin, M., & Weiskopf, D. (2011). Evaluation of Traditional, Orthogonal, and Radial Tree Diagrams by an Eye Tracking Study. IEEE Transactions on Visualization and Computer Graphics, 17(12), 2440–2448. http://doi.org/10.1109/TVCG.2011.193 pdf online
- Nieselt, K., Dietzsch, J., Heinrich, J., Pritzkau, A., Mosisch, M., & Bartz, D. (2009). Visuelle Analytik für Genexpressionsdaten. Datenbank-Spektrum, 9(31), 26–32.
- Heinrich, J., & Weiskopf, D. (2009). Continuous Parallel Coordinates. IEEE Transactions on Visualization and Computer Graphics, 15(6), 1531–1538. http://doi.org/10.1109/TVCG.2009.131 pdf online
- Vizcaino, J., Gonzalez, F., Suarez, M. B., Redondo, J., Heinrich, J., Jarana, J. D., … Rey, M. (2006). Generation, annotation and analysis of ESTs from Trichoderma harzianum CECT 2413. BMC Genomics, 7(1). http://doi.org/10.1186/1471-2164-7-193
Conferences (peer-reviewed)
- Engelke, U., Vuong, J., & Heinrich, J. (2016). Visual Performance in Multidimensional Data Characterisation with Scatterplots and Parallel Coordinates. In IS&T Human Vision and Electronic Imaging. pdf
- Heinrich, J., Kaur, S., & O’Donoghue, S. I. (2015). Evaluating the Effectiveness of Color to Convey Alignment Quality in Macromolecular Structures. In Proceedings of the 1st IEEE International Symposium on Big Data Visual Analytics. pdf
- Heinrich, J., & Broeksema, B. (2015). Big Data Visual Analytics with Parallel Coordinates. In Big Data Visual Analytics (BDVA), 2015 (pp. 1–2). http://doi.org/10.1109/BDVA.2015.7314286 pdf
- Heinrich, J., Burch, M., & O’Donoghue, S. I. (2014). On the use of 1D, 2D, and 3D visualisation for molecular graphics. In 2014 IEEE VIS International Workshop on 3DVis (3DVis) (pp. 55–60). http://doi.org/10.1109/3DVis.2014.7160101 pdf
- Heinrich, J., & Weiskopf, D. (2013). State of the Art of Parallel Coordinates. In STAR Proceedings of Eurographics 2013 (pp. 95–116). Eurographics Association. pdf
- Heinrich, J., & Weiskopf, D. (2013). Parallel-Coordinates Art. In Proceedings of the IEEE VIS Arts Program (VISAP). Atlanta, GA, USA. pdf
- Vehlow, C., Hasenauer, J., Kramer, A., Heinrich, J., Radde, N., Allgöwer, F., & Weiskopf, D. (2012). Uncertainty-Aware Visual Analysis of Biochemical Reaction Networks. In Proceedings of the IEEE Symposium on Biological Data Visualization (Vol. 2012). pdf
- Heinrich, J., Stasko, J., & Weiskopf, D. (2012). The Parallel Coordinates Matrix. In EuroVis–Short Papers (pp. 37–41). pdf
- Heinrich, J., Luo, Y., Kirkpatrick, A. E., & Weiskopf, D. (2012). Evaluation of a Bundling Technique for Parallel Coordinates. In Proceedings of the International Conference on Computer Graphics Theory and Applications and International Conference on Information Visualization Theory and Applications (pp. 594–602). pdf
- Vehlow, C., Heinrich, J., Battke, F., Weiskopf, D., & Nieselt, K. (2011). iHAT: interactive Hierarchical Aggregation Table. In J. Kennedy & J. Roerdink (Eds.), Proceedings of the IEEE Symposium on Biological Data Visualization (pp. 63–69). IEEE Computer Society Press.
- Heinrich, J., Seifert, R., Burch, M., & Weiskopf, D. (2011). BiCluster Viewer : A Visualization Tool for Analyzing Gene Expression Data. In Proceedings of the International Symposium on Visual Computing (pp. 641–652). Springer. pdf
- Hasenauer, J., Heinrich, J., Doszczak, M., Scheurich, P., & Allgöwer, F. (2011). Visualization methods and support vector machines as tools for determining markers in models of heterogeneous populations: Proapoptotic signaling as a case study. In Proceedings of the Workshop on Computational Systems Biology (pp. 61–64).
- Bosch, H., Heinrich, J., Müller, C., Höferlin, B., Reina, G., Höferlin, M., … Koch, S. (2009). Innovative Filtering Techniques and Customized Analytic Tools. In Proceedings of the IEEE Symposium on Visual Analytics Science and Technology (pp. 269–270). IEEE Computer Society Press.
- Dietzsch, J., Heinrich, J., Nieselt, K., & Bartz, D. (2009). SpRay: A Visual Analytics Approach for Gene Expression Data. In Proceedings of the IEEE Symposium on Visual Analytics Science and Technology (pp. 179–186). http://doi.org/10.1109/VAST.2009.5333911 pdf online